13 Resterampe
13.0.1 Character meta data
We will now combine this information with additional meta data about characters, i.e., gender.
# Proportion of male / female characters
barplot(table(text$characters$Gender),col=qd.colors)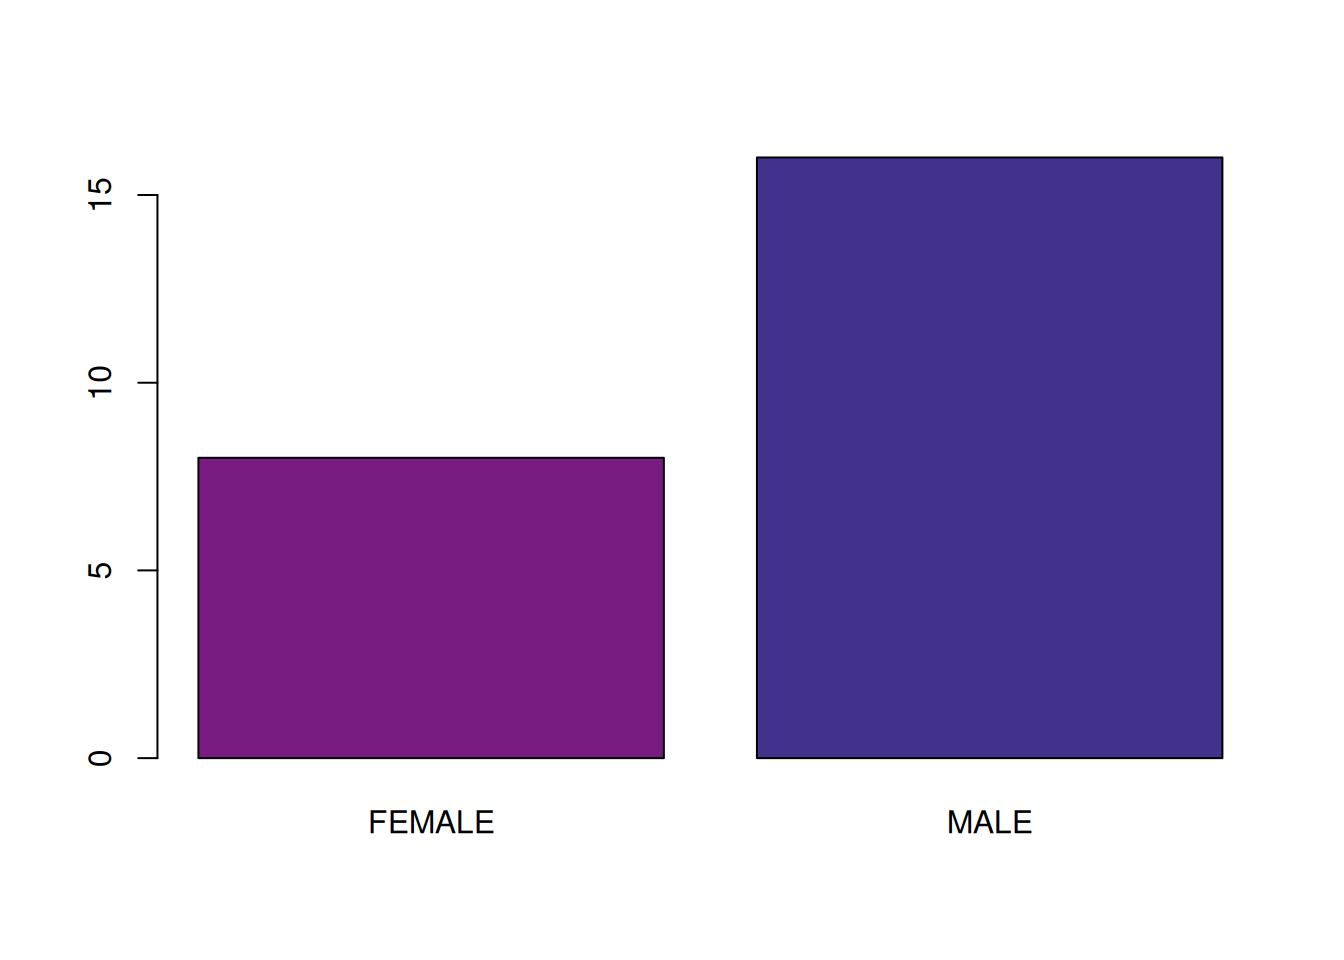
13.0.2 Character groups
Next, we want to make the same analysis not for individual characters, but for character groups, based on categories such as gender.
ustat <- utteranceStatistics(rjmw.0,
                             normalizeByDramaLength = FALSE # use absolute values
                            )

characterdata <- rjmw.0$characters

ustat <- merge(ustat, characterdata,
               by.x = c("corpus","drama", "character"),
               by.y = c("corpus","drama", "figure_id"))

par(mar=c(2,2,2,2))
boxplot(utteranceLength ~ Gender, # what do we want to correlate
        data=ustat,
        las = 1 # rotate axis labels
      )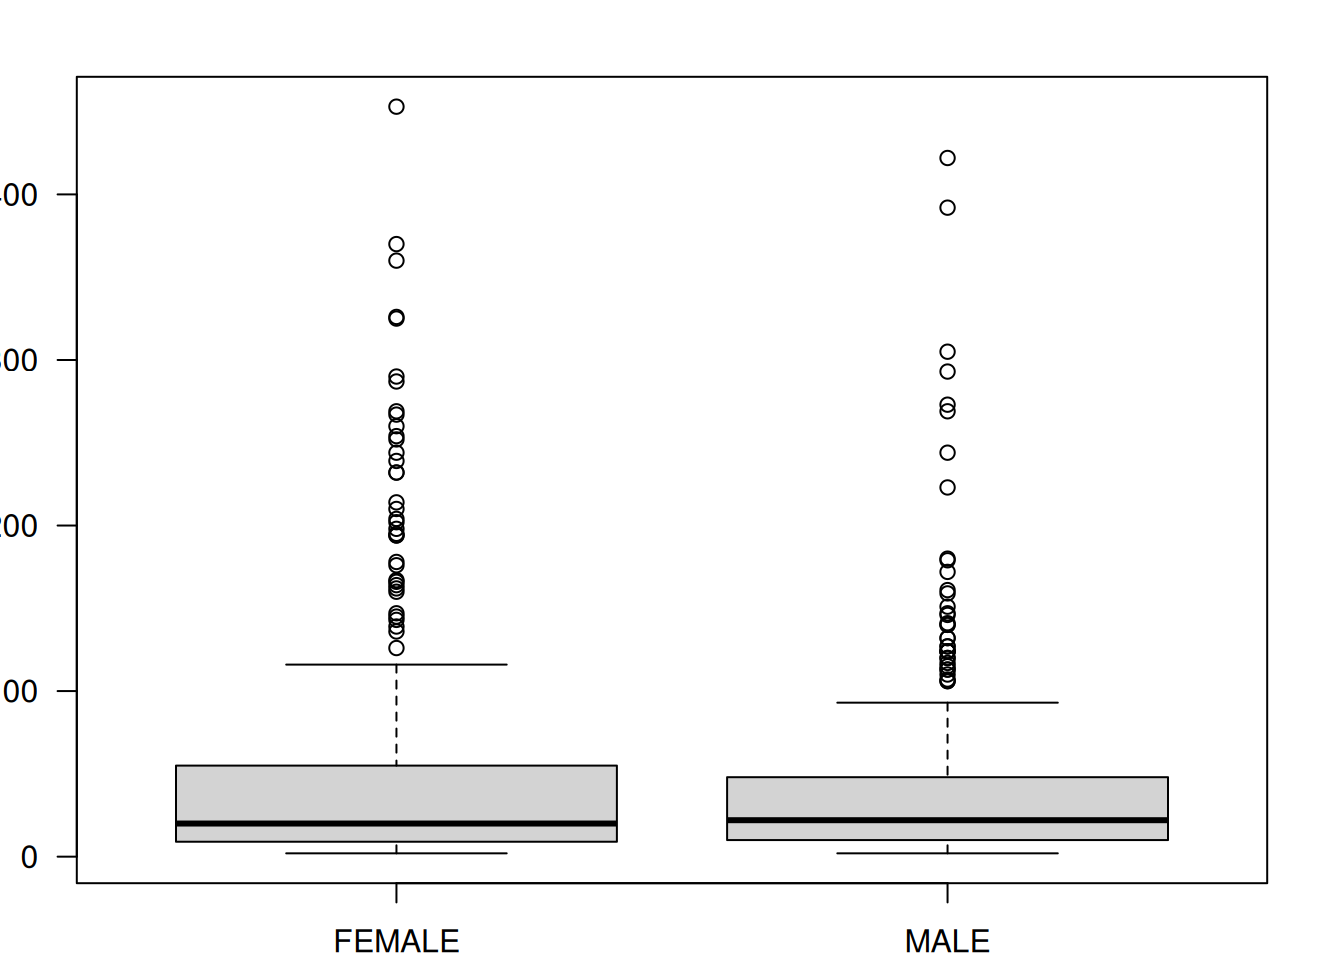
According to this picture, female characters speak slightly longer utterances in this play.